About This Project
Personal health care cost data contains information about the costs associated with individuals' health care. This dataset is used to train a model that can predict costs associated with health care for specific individuals. Using predictive modelling, insurers and healthcare providers can identify financial risks and plan financial estimates for insured individuals. View on Kaggle →
| # | Column | Description |
|---|---|---|
| 1 | age | Age of primary beneficiary |
| 2 | sex | Insurance contractor gender (female / male) |
| 3 | bmi | Body mass index — objective index of body weight (kg/m²). Ideal range: 18.5 to 24.9 |
| 4 | children | Number of children covered by health insurance / Number of dependents |
| 5 | smoker | Smoking status (yes / no) |
| 6 | region | The beneficiary's residential area in the US (northeast, southeast, southwest, northwest) |
| 7 | charges | Individual medical costs billed by health insurance (target) |
| Column | Max | Min | Unique Values |
|---|---|---|---|
| age | 64.0 | 18.0 | 47 |
| sex | — | — | 2 |
| bmi | 53.13 | 15.96 | 548 |
| children | 5.0 | 0.0 | 6 |
| smoker | — | — | 2 |
| region | — | — | 4 |
| charges | 63770.42801 | 1121.8739 | 1337 |
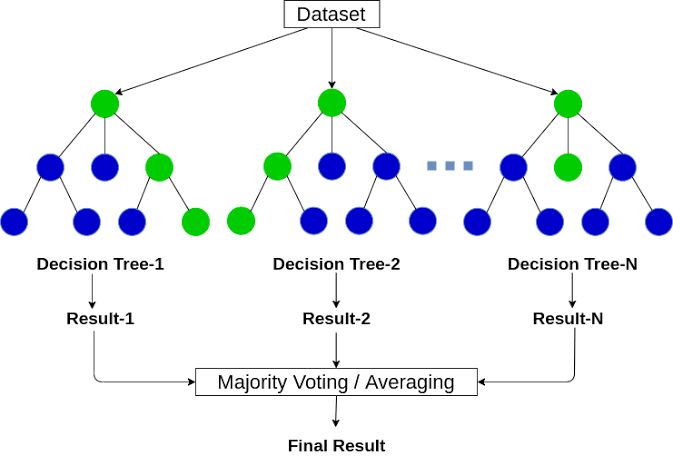
Random Forest is a supervised machine-learning algorithm made up of decision trees. It is an ensemble technique — a meta-estimator that fits multiple decision trees on various sub-samples of the dataset and uses averaging to improve predictive accuracy and control over-fitting. It is less prone to over-fitting than a single decision tree and generally offers greater prediction stability for numerical targets like insurance costs.
Categorical features (sex,
smoker,
region)
are transformed to numerical using One-Hot Encoding (pd.get_dummies).
Feature selection via f_regression
identified smoker and age
as the two most predictive features.

from sklearn.feature_selection import f_regression, SelectKBest
mic = SelectKBest(score_func=f_regression, k=2)
mic.fit(x, y)
feature_MI_score = pd.Series(mic.scores_, index=x.columns)
feature_MI_score.sort_values(ascending=False)
The model is evaluated on a held-out 20% test set with a fixed random seed for reproducibility.